> ## Documentation Index
> Fetch the complete documentation index at: https://docs.apiyi.com/llms.txt
> Use this file to discover all available pages before exploring further.
# Log Query API
> Retrieve call logs programmatically to get the model, actual charge, latency, and error code for every request, enabling automated reconciliation and self-service troubleshooting
## API Overview
The Log Query API returns a detailed record of **every API call** made under your account,
including the model used, the actual amount charged, latency, whether the call was streamed,
and the error code when a call fails.
It complements the [Balance Query API](/en/api-capabilities/balance-query): balance query tells
you how much credit is left, log query tells you where it went.
Three typical use cases:
Aggregate actual spend by time range or by model and reconcile it against your own billing
Inspect error codes on failed requests to tell parameter problems from upstream problems
Provide the `request_id` to support so they can pinpoint the exact call
Logs are also viewable in the console under the Logs page. This API is the programmatic entry
point to the same data, intended for automated reconciliation, scheduled exports, or feeding
your own monitoring. For manual inspection, use the console — see
[How to view my call records](/en/faq/call-logs).
**Recommended usage: sync once a day and store the logs in your own database.**
This API is designed for scheduled incremental export, not for repeated real-time querying:
* **Run it once a day**, pulling only records created since your last sync, into your own
database or a CSV file
* **Fetch more per request**: `pageSize` goes up to 5000 — do not leave it at the default of 10.
See the parameter notes below for the pitfall here
* **Do not** use it for bulk backfills (pulling three months in one go), and do not drive
live pagination in a UI with it
* **Do not call it concurrently** — page through serially, with about one second between pages
* Keep each time window to **one day or less**; split by the hour for high-volume accounts
See the Performance Notes section below for why: the older the window and the deeper the
pagination, the more each request costs. Past the server-side limit you get an error back, and
**retrying the same parameters will not be any faster**. The Python example on this page already
follows this pattern and can be dropped straight into a daily cron job.
## How to Get Your System Token
The Log Query API authenticates with a **System Token**, which is not the same thing as an
API key (see Important Notes at the end of this page).
Visit `api.apiyi.com/account/profile` to access your profile page
Locate the "Account Options - System Token" section at the bottom of the page
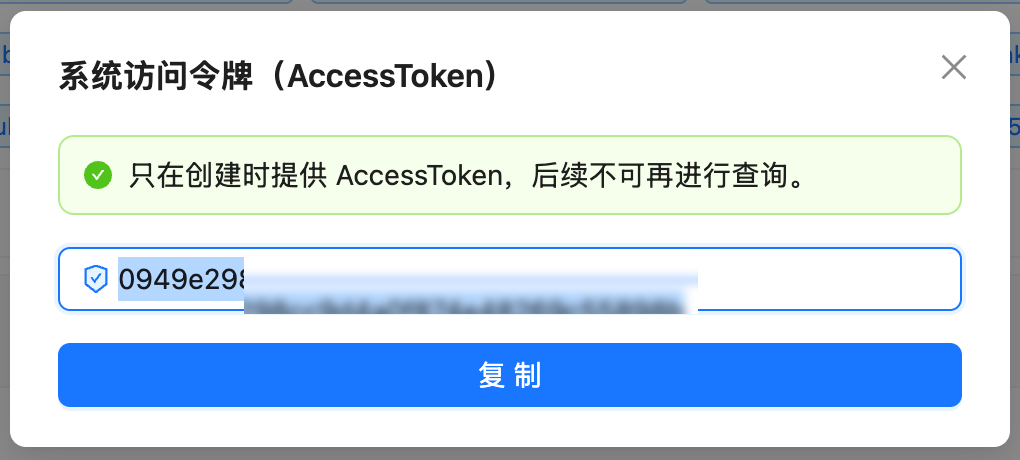
Enter your account password to receive an AccessToken that can be used for subsequent API queries
 ## API Information
| Item | Description |
| - | - |
| **API URL** | `https://api.apiyi.com/api/log/self` |
| **Method** | `GET` |
| **Authentication** | Authorization header (raw token string, **no `Bearer` prefix**) |
| **Response Format** | JSON (gzip compressed) |
| **Data Scope** | Your own account's logs only |
## Request Details
### Request Headers
| Header Name | Required | Description |
| - | - | - |
| `Authorization` | Yes | System token, passed as the raw token string |
| `Accept` | No | Recommended: `application/json` |
### Query Parameters
| Parameter | Type | Required | Description |
| - | - | - | - |
| `p` | Integer | No | Page number, **zero-based** (not 1). Offset = `p` × `pageSize` |
| `pageSize` | Integer | No | Records per page, default 10, **maximum 5000**. ⚠️ **camelCase** — see the warning below |
| `type` | Integer | No | Log type; pass `2` for reconciliation, see the table below |
| `model_name` | String | No | Exact-match filter by model, e.g. `gpt-5.6` |
| `token_name` | String | No | Filter by token name |
| `request_id` | String | No | Look up a single call by request ID; returns just that record |
| `start_timestamp` | Integer | **Required** | Start time, Unix seconds. See the note below |
| `end_timestamp` | Integer | **Required** | End time, Unix seconds. Keep the span from `start_timestamp` to one day or less |
| `group` | String | No | Filter by group |
**Treat the time window as required.**
The endpoint does not actually enforce these two parameters — a call without them succeeds. But
omitting them tells the server to search your account's **entire history** backwards from the
newest record, and **accounts with a large call history will hit the server-side limit and get an
error rather than a slow response**.
This is the easiest mistake to make on this page and the one with the most direct consequences.
We mark it Required not because the server rejects the call, but because **the failure mode is
hard to recognize**: it does not report a missing parameter, it reports a timeout.
**`pageSize` is the only camelCase parameter on this endpoint. Spelling it `page_size` is
silently ignored.**
Every other parameter (`model_name`, `token_name`, `start_timestamp`, `request_id`, …) uses
snake\_case — this one does not. Getting it wrong does not raise an error: the server treats the
parameter as absent and **falls back to the default of 10 records per page**, which is easy to
misread as "the cap is 10" or "I only made 10 calls in this period."
```
?pageSize=1000 ✅ returns 1000 records
?page_size=1000 ❌ silently returns 10
```
Going above 5000 does raise a clear error rather than truncating silently.
**Raising `pageSize` is the single most effective optimization for this endpoint.** At 10 records
per page, an account making 500,000 calls a day needs 50,000 requests; at 5000 per page it needs
**100**. Two orders of magnitude fewer requests, and the pagination offset drops with it — see
Performance Notes below.
A 5000-record page measures roughly 700 KB gzipped and takes about 2.5 seconds. If bandwidth or
memory is tight, `1000` is a comfortable middle ground.
### Performance Notes
The cost of a single request is **not fixed**. It depends on three things. Follow these rules and
the API is fast; ignore them and you will hit the server-side 60-second query limit and get an
error back.
| Factor | Cheap | Expensive |
| - | - | - |
| **Where the window sits** | The last few days | Weeks or months ago |
| **How wide the window is** | 1 hour to 1 day | A whole month, or no window at all |
| **Offset (`p` × `pageSize`)** | The first few tens of thousands of records | Hundreds of thousands and beyond |
Four practical rules:
1. **Always pass `start_timestamp` and `end_timestamp`.** Omitting the window is the single most
expensive way to call this API.
2. **Raise `pageSize`.** This is the easy one: going from 10 to 1000–5000 records per page cuts
the request count by two orders of magnitude, and the offset falls with it.
3. **Shrink the window instead of deepening the offset.** What costs money is not "which page"
but "how many records were skipped to get there", and that grows super-linearly. Rather than
paging all the way through one large window, split it into 24 one-hour windows so every
window starts again from offset 0.
4. **Backfill history once, store it, then only sync increments.** Old data costs far more to
query than recent data, so repeatedly re-reading the same history is pure waste.
If a window still takes dozens of pages at `pageSize=1000`, your call volume for that period is
high — **split the window in half and fetch each half separately**. That is much faster than
paging deeper. The `MAX_PAGES` constant in the Python example below does exactly this.
#### 60 seconds is a hard limit, and exceeding it returns an error
The server caps any single query at **60 seconds**. Past that you do not get a slow response —
**you get an error**, and the time already spent buys you no data at all.
These three patterns are likely to trigger it. Avoid them outright rather than retrying and
hoping:
| Pattern | Why |
| - | - |
| **No time window** | The server has to search your entire history |
| **A window a month or more in the past**, on a high-volume account | Older data costs more to retrieve |
| **An offset in the hundreds of thousands** | The more records skipped, the slower — super-linearly |
**Retrying with the same parameters will not be faster**, it just costs another 60 seconds. The
right response is to **narrow the time window**, or raise `pageSize` so there is less paging —
either way, give the server less data to work through per call.
### Log Types
| Value | Meaning | Notes |
| - | - | - |
| `1` | Top-up | Records balance before and after; `quota` is 0 |
| `2` | **Consumption** | **The only type you need for reconciliation**; `quota` is the actual charge |
| `3` | Administrative | Account changes and similar operations; `quota` is 0 |
| `4` | System | System-granted credit and similar; `quota` is 0 |
| `11` | Async task refund | The pre-charge is refunded in full when a video or other async task fails; `quota` is **negative** and `content` carries the task\_id |
**Always pass `type=2` when calculating spend.** Without it, top-up and system-grant records are
returned as well. Their `quota` is 0, but `model_name` and `token_name` are also empty, so naively
summing or grouping by model will produce wrong results.
If the account uses async video models (Seedance and similar), **also pull `type=11`**: when a task fails, its pre-charge comes back as a negative refund entry, and summing only `type=2` would count that pre-charge as spend.
## Response Details
### Success Response Example
```json theme={null}
{
"success": true,
"message": "",
"data": [
{
"request_id": "2026080114481936471351696e93ae3FTV8WKfk",
"created_at": 1785595715,
"type": 2,
"content": "Fixed model price 0.015, group ratio 1",
"username": "your-account",
"token_name": "production-primary",
"token_group": "default",
"model_name": "gpt-5.6",
"quota": 7500,
"prompt_tokens": 1000,
"completion_tokens": 0,
"duration_for_view": 16,
"is_stream": false,
"error_code": "",
"other": "{\"billing_type\":\"by_count\",\"request_path\":\"/v1/images/generations\",\"group_ratio\":1,\"model_ratio\":1,\"usage\":{}}"
}
]
}
```
### Key Response Fields
| Field Name | Type | Description |
| - | - | - |
| `quota` | Integer | **The amount actually charged for this call**, in credits; ÷ 500,000 = USD |
| `content` | String | Human-readable pricing note, e.g. fixed model price and group ratio |
| `model_name` | String | The model actually billed |
| `token_name` | String | Which API key made the call |
| `token_group` | String | The token's group — note this is the group identifier, see FAQ |
| `prompt_tokens` / `completion_tokens` | Integer | Input / output token counts |
| `duration_for_view` | Integer | Call duration in seconds |
| `is_stream` | Boolean | Whether the call was streamed |
| `error_code` | String | Failure reason code; empty string on success |
| `created_at` | Integer | Call time, Unix seconds |
| `request_id` | String | **Request ID — provide this when opening a support ticket** |
| `other` | String | Additional billing and request detail, **a JSON string that must be parsed again** |
The `other` field holds a JSON **string**, not a nested object, so it needs a second parse
(`json.loads()` in Python, `JSON.parse()` in JavaScript). It contains `billing_type`,
`request_path` (the endpoint actually called), `group_ratio`, `model_ratio`, and `usage`.
Settlement entries for async video tasks also carry `final_quota` (the task's final total), `original_quota`
(the pre-charge taken at submission), `adjustment_quota` (this entry's difference) and `actual_tokens`; see the FAQ below.
### Quota Conversion
500,000 quota = \$1.00 USD
**Formula:** USD amount = `quota` ÷ 500,000
**Examples:**
* `quota: 7500` → \$0.015 USD
* `quota: 22500` → \$0.045 USD
* `quota: 18` → \$0.000036 USD
This is the same conversion used by the [Balance Query API](/en/api-capabilities/balance-query),
so the two line up directly.
## Error Responses
### HTTP 401 - Authentication Failed
```json theme={null}
{
"success": false,
"message": "You are not authorized to perform this operation. The access token is invalid."
}
```
**Reason:** The system token is invalid or expired, or an API key (starting with `sk-`) was
mistakenly used as a system token.
**Solution:** Regenerate the system token in the console, and make sure `Authorization` carries
the raw value **without a `Bearer` prefix**.
## Code Examples
### cURL Example (single page, quick check)
```bash theme={null}
export APIYI_SYS_TOKEN='YOUR_SYSTEM_TOKEN'
# Last hour only. Always pass start/end — a query without a time window will likely time out
END=$(date +%s)
START=$((END - 3600))
curl --compressed -s "https://api.apiyi.com/api/log/self?p=0&pageSize=1000&type=2&start_timestamp=$START&end_timestamp=$END" \
-H "Authorization: $APIYI_SYS_TOKEN" \
-H 'Accept: application/json' | jq '.data[] | {created_at, model_name, quota, request_id}'
```
**The `--compressed` option is required**, because the API returns gzip-compressed content.
Without it you will get garbled output.
Use this to confirm your token works. For real reconciliation, use the daily sync script below.
### Python Example: daily incremental sync (ready to use as a cron job)
This is the **recommended standard usage**: run it once a day, pull only what is new since the
last sync, and write it into a local SQLite database. Re-running is safe (records are
deduplicated on `request_id`), and a run interrupted halfway resumes from where it stopped.
```python theme={null}
"""Daily incremental sync of APIYI call logs. Run once a day, e.g. crontab: 30 2 * * *"""
import json
import os
import sqlite3
import time
import requests
BASE = "https://api.apiyi.com"
TOKEN = os.environ["APIYI_SYS_TOKEN"]
QUOTA_PER_USD = 500_000
DB_PATH = "apiyi_logs.db"
WINDOW = 3600 # width of one time window in seconds; 1 hour suits most accounts
PAGE_SIZE = 1000 # records per page, server max is 5000. NOTE: the param is camelCase
MAX_PAGES = 50 # max pages per window; beyond this the window is split in half
SLEEP = 1.0 # gap between pages — call serially, never concurrently
FIRST_RUN_DAYS = 7 # how far back to backfill on the very first run
HEADERS = {"Authorization": TOKEN, "Accept": "application/json"}
def open_db():
con = sqlite3.connect(DB_PATH)
con.execute("""
CREATE TABLE IF NOT EXISTS logs (
request_id TEXT PRIMARY KEY,
created_at INTEGER,
model_name TEXT,
token_name TEXT,
quota INTEGER,
error_code TEXT,
raw TEXT
)""")
con.execute("CREATE INDEX IF NOT EXISTS idx_created ON logs(created_at)")
con.commit()
return con
def get_page(start, end, page):
resp = requests.get(
f"{BASE}/api/log/self",
headers=HEADERS,
params={
"p": page,
"pageSize": PAGE_SIZE, # camelCase! page_size is ignored and you get 10 per page
"type": 2, # 2 = consumption, the only type used for reconciliation
"start_timestamp": start,
"end_timestamp": end,
},
timeout=60, # the server-side query limit is also 60 seconds
)
resp.raise_for_status()
return resp.json().get("data") or []
def fetch_window(start, end):
"""Fetch [start, end]. Splits the window in half if pagination gets too deep."""
rows, seen, page = [], set(), 0
while page < MAX_PAGES:
data = get_page(start, end, page)
if not data:
return rows # empty array means this window is done
fresh = [r for r in data if r.get("request_id") not in seen]
if not fresh:
return rows # whole page was duplicates, defensive exit
seen.update(r["request_id"] for r in fresh)
rows.extend(fresh)
page += 1
time.sleep(SLEEP)
if end - start <= 1:
return rows
mid = (start + end) // 2 # too much volume here: fetch each half separately
return fetch_window(start, mid) + fetch_window(mid + 1, end)
def sync():
con = open_db()
row = con.execute("SELECT MAX(created_at) FROM logs").fetchone()
cursor = (row[0] + 1) if row and row[0] else int(time.time()) - FIRST_RUN_DAYS * 86400
now = int(time.time())
total = 0
while cursor < now:
end = min(cursor + WINDOW, now)
rows = fetch_window(cursor, end)
con.executemany(
"INSERT OR IGNORE INTO logs VALUES (?,?,?,?,?,?,?)",
[(r.get("request_id"), r.get("created_at"), r.get("model_name"),
r.get("token_name"), r.get("quota"), r.get("error_code"),
json.dumps(r, ensure_ascii=False)) for r in rows])
con.commit()
total += len(rows)
cursor = end + 1
print(f"Synced {total} records into {DB_PATH}")
return con
def report(con, days=1):
since = int(time.time()) - days * 86400
print(f"{'MODEL':32s} {'CALLS':>6s} {'SPEND(USD)':>12s}")
rows = con.execute(
"SELECT model_name, COUNT(*), SUM(quota) FROM logs "
"WHERE created_at >= ? GROUP BY model_name ORDER BY SUM(quota) DESC",
(since,)).fetchall()
for model, cnt, quota in rows:
print(f"{model or '(none)':32s} {cnt:6d} {(quota or 0) / QUOTA_PER_USD:12.4f}")
total = sum((q or 0) for _, _, q in rows)
print(f"\nTotal ${total / QUOTA_PER_USD:.4f} USD")
if __name__ == "__main__":
report(sync(), days=1)
```
**Sample output:**
```
Synced 570 records into apiyi_logs.db
MODEL CALLS SPEND(USD)
gpt-5.6 128 2.3850
gemini-3-pro-image 30 1.3500
deepseek-chat 412 0.0148
Total $3.7348 USD
```
Once the data is local, every breakdown you need — by model, by day, by token — runs against
your own database, so **you never have to query the API again for it**. That is far faster, and
it sidesteps the problem of wanting data that has already aged out of the retention window.
### Node.js Example (single time window)
Same idea: split by the hour, page serially, and shrink the window if pagination gets too deep.
```javascript theme={null}
const BASE = "https://api.apiyi.com";
const TOKEN = process.env.APIYI_SYS_TOKEN;
const QUOTA_PER_USD = 500_000;
const PAGE_SIZE = 1000; // server max is 5000
const MAX_PAGES = 50;
const sleep = (ms) => new Promise((r) => setTimeout(r, ms));
async function getPage(start, end, page) {
const qs = new URLSearchParams({
p: String(page),
pageSize: String(PAGE_SIZE), // camelCase! page_size is ignored and you get 10 per page
type: "2", // 2 = consumption
start_timestamp: String(start),
end_timestamp: String(end),
});
const resp = await fetch(`${BASE}/api/log/self?${qs}`, {
headers: { Authorization: TOKEN, Accept: "application/json" },
});
if (!resp.ok) throw new Error(`HTTP ${resp.status}`);
const { data } = await resp.json();
return data || [];
}
// Fetch [start, end]; split the window in half if pagination gets too deep
async function fetchWindow(start, end) {
const rows = [];
const seen = new Set();
for (let page = 0; page < MAX_PAGES; page += 1) {
const data = await getPage(start, end, page);
if (data.length === 0) return rows;
const fresh = data.filter((r) => !seen.has(r.request_id));
if (fresh.length === 0) return rows;
fresh.forEach((r) => seen.add(r.request_id));
rows.push(...fresh);
await sleep(1000); // serial, never concurrent
}
if (end - start <= 1) return rows;
const mid = Math.floor((start + end) / 2);
return [...(await fetchWindow(start, mid)), ...(await fetchWindow(mid + 1, end))];
}
const end = Math.floor(Date.now() / 1000);
const logs = await fetchWindow(end - 3600, end); // last hour
const total = logs.reduce((sum, r) => sum + (r.quota || 0), 0);
console.log(`${logs.length} calls, $${(total / QUOTA_PER_USD).toFixed(4)} USD`);
```
Both the Python requests library and the Node.js fetch API decompress gzip automatically,
so no extra configuration is needed there. Only curl requires the explicit `--compressed` flag.
## Common Scenarios
### Daily reconciliation (the recommended approach)
Schedule the Python script above to run once a day and land the logs in a local database. Every
breakdown you need — total spend, per model, per token — is then a SQL query against **your own**
database.
Three reasons this is the right shape: local queries are fast; you are not exposed to the log
retention window; and you avoid slowing the API down by repeatedly re-reading old history.
To sync only one model's records, add the `model_name` parameter to the request.
### Finding failed calls
Once the data is local, query your own table directly:
```sql theme={null}
SELECT created_at, model_name, error_code, request_id
FROM logs
WHERE error_code != '' AND created_at >= strftime('%s', 'now', '-1 day')
ORDER BY created_at DESC;
```
Requests rejected by the gateway (invalid parameters and similar) have `quota` of 0 and
**are not charged**. The `error_code` in the log lets you separate "the call failed" from
"the call succeeded but I did not like the result."
### Providing a request ID for support
Locate the problematic call in the logs and give support the `request_id`. That identifies the
exact request end to end, which is far more efficient than describing "a call to some model
failed around a certain time."
## FAQ
Check these three things first; almost every slow query comes from one of them:
1. **Are you passing `start_timestamp` and `end_timestamp`?** Omitting the time window is the
most expensive way to call this API — the server searches your entire history.
2. **Is the window too old or too wide?** Querying data from a month ago costs far more than
querying yesterday. Keep the span under one day, and split by the hour for high volumes.
3. **Has `p` reached several thousand?** Pagination cost grows super-linearly. The fix is to
**shrink the time window so each window needs only a few dozen pages**, not to page deeper
within one large window.
**Retrying the same parameters will not be faster.** On a timeout, adjust the parameters as
above rather than repeating the identical request — a plain retry just makes you wait again.
**Nine times out of ten, the parameter was spelled `page_size` in snake\_case.**
The correct spelling is camelCase `pageSize`. It is the only camelCase parameter on this
endpoint — everything else (`model_name`, `token_name`, `start_timestamp`, …) is snake\_case,
which makes this an easy one to get wrong. It does not raise an error; the server treats the
parameter as absent and falls back to 10 records per page.
```
?pageSize=1000 ✅ 1000 records
?page_size=1000 ❌ 10 records
```
The maximum is 5000, and going above that returns a clear error. For large volumes you still
need to paginate (`p=0`, `p=1`, …) until the response returns an empty array — the Python and
Node.js examples above already encapsulate this.
Yes — pass `request_id`, and only that record is returned:
```bash theme={null}
curl --compressed -s "https://api.apiyi.com/api/log/self?request_id=YOUR_REQUEST_ID" \
-H "Authorization: $APIYI_SYS_TOKEN"
```
When investigating one specific call, this is much faster than pulling a time range and
filtering it yourself.
No. Certain fields hold platform-internal information and are empty or zero from a regular
account's perspective. This is expected and does not affect the fields you need for
reconciliation or troubleshooting — `quota`, `model_name`, `error_code`, and `request_id`
are all fully populated.
The API returns the group **identifier**, while the console displays the group's **label**.
These can differ — for example the API returns `default` while the console shows Default.
The full mapping is available from the public endpoint `https://api.apiyi.com/api/pricing`
under the `usable_group` field, which maps identifier to label. If you want your reports to
match the console, apply that mapping yourself.
Use `quota`. It is the amount **actually deducted** for the call and the only field suitable
for reconciliation. For per-call priced models such as image and video generation, the token
counts in the response may be placeholder values that do not participate in pricing —
those models report `by_count` in `other.billing_type`.
**Design your sync logic assuming only the last 30 days are queryable.**
In practice the queryable range is usually longer, but we **make no commitment on retention**
— it changes with log cleanup policy, and changes are not announced separately. Treat 30 days
as your planning floor and your reconciliation will not break when that policy shifts.
Separately, **the older the window, the more the query costs**: even when the data is still
there, reaching it is much slower.
So the right pattern is to **sync once a day into your own database** and run historical
analysis locally. Anything you need to keep long term, archive yourself — do not rely on this
API to fetch it back.
**Reason:** the API returns gzip-compressed content (`Content-Encoding: gzip`) and curl is
not decompressing it.
**Solution:** add the `--compressed` flag:
```bash theme={null}
curl --compressed 'https://api.apiyi.com/api/log/self?p=0' \
-H "Authorization: $APIYI_SYS_TOKEN" | jq
```
The Python requests library and the Node.js fetch API decompress automatically.
Async video tasks (Seedance and similar) are billed as "pre-charge at submission, settle the difference on completion",
so one video leaves two entries: the pre-charge (`completion_tokens` is 0, `request_id` present) and the settlement
(`completion_tokens` is the actual usage, **`request_id` is empty**, `quota` is only the difference).
**Neither entry carries the `task_id`**, so this API cannot pair entries to tasks.
To get a video's real cost, query the task API by `task_id`; its `quota` is the sum of the two entries:
```bash theme={null}
curl --compressed -s "https://api.apiyi.com/api/task/self?p=1&page_size=1&task_id=YOUR_TASK_ID" \
-H "Authorization: $APIYI_SYS_TOKEN"
```
Note that its paging parameters are snake\_case `page_size` with `p` starting at 1, the opposite of this API.
A failed task still shows its pre-charge in `quota`, but its real cost is 0 (the logs contain a negative `type=11` refund entry).
Full walkthrough: [How to look up a Seedance video's real cost by task\_id](/en/faq/seedance-task-cost-lookup).
No. The log query endpoint does not consume any quota.
## Important Notes
**A system token is not an API key, and the two are not interchangeable**
* An **API key** (starting with `sk-`) is for `/v1/*` inference endpoints. Using it against
`/api/log/self` returns 401.
* A **system token** (a plain string with no prefix) is for `/api/*` management endpoints.
Using it against `/v1/chat/completions` returns an invalid-token error.
A system token's scope covers your entire account, so **treat it like your account password**:
store it in a secret manager rather than in code, never commit it to a repository, and rotate
it periodically.
**Log responses contain your own API keys in plain text**
Each log record carries information about the token that made the call. **Do not paste raw log
responses into public places, share screenshots of them, or hand them to third parties** —
strip sensitive fields before exporting.
Note in particular that this plaintext does not carry the `sk-` prefix, so **common secret
scanners may not detect it**. Do not rely on automated checks to catch it for you.
**Recommended call pattern**
* **Sync once a day** — no need to go more often; each run pulls only what is new
* **Use `pageSize` of 1000–5000**, not the default of 10 — this one matters more than the rest combined
* **Call serially**, roughly one second between pages, **never concurrently**
* Set the client timeout to 60 seconds (the server-side query limit is also 60 seconds)
* Keep each time window to one day or less; split by the hour for high-volume accounts
* On a timeout, **shrink the window before retrying** — an identical retry will not be faster
These are not hard quotas; they are simply the fastest way to get your own data out. Following
this pattern, a typical account syncs a full day of logs in under a minute, and even a heavy
account making hundreds of thousands of calls a day needs only about a hundred requests.
**We reserve the right to introduce rate limiting on this endpoint in the future.**
There is no rate limit on it today, but please **do not design your scheduled jobs around
"unlimited"**. Follow the pattern above — once a day, serial, a large `pageSize` — and a future
rate limit will not affect you.
* [Balance Query API](/en/api-capabilities/balance-query) — check remaining account credit
* [Token Management API](/en/api-capabilities/token-management) — create and manage API keys programmatically
* [How to view my call records](/en/faq/call-logs) — manual inspection in the console
* [Understanding logs and billing](/en/faq/log-billing-explained) — how to read the billing fields
This documentation is built and hosted on [Mintlify](https://mintlify.com), a developer documentation platform.
## API Information
| Item | Description |
| - | - |
| **API URL** | `https://api.apiyi.com/api/log/self` |
| **Method** | `GET` |
| **Authentication** | Authorization header (raw token string, **no `Bearer` prefix**) |
| **Response Format** | JSON (gzip compressed) |
| **Data Scope** | Your own account's logs only |
## Request Details
### Request Headers
| Header Name | Required | Description |
| - | - | - |
| `Authorization` | Yes | System token, passed as the raw token string |
| `Accept` | No | Recommended: `application/json` |
### Query Parameters
| Parameter | Type | Required | Description |
| - | - | - | - |
| `p` | Integer | No | Page number, **zero-based** (not 1). Offset = `p` × `pageSize` |
| `pageSize` | Integer | No | Records per page, default 10, **maximum 5000**. ⚠️ **camelCase** — see the warning below |
| `type` | Integer | No | Log type; pass `2` for reconciliation, see the table below |
| `model_name` | String | No | Exact-match filter by model, e.g. `gpt-5.6` |
| `token_name` | String | No | Filter by token name |
| `request_id` | String | No | Look up a single call by request ID; returns just that record |
| `start_timestamp` | Integer | **Required** | Start time, Unix seconds. See the note below |
| `end_timestamp` | Integer | **Required** | End time, Unix seconds. Keep the span from `start_timestamp` to one day or less |
| `group` | String | No | Filter by group |
**Treat the time window as required.**
The endpoint does not actually enforce these two parameters — a call without them succeeds. But
omitting them tells the server to search your account's **entire history** backwards from the
newest record, and **accounts with a large call history will hit the server-side limit and get an
error rather than a slow response**.
This is the easiest mistake to make on this page and the one with the most direct consequences.
We mark it Required not because the server rejects the call, but because **the failure mode is
hard to recognize**: it does not report a missing parameter, it reports a timeout.
**`pageSize` is the only camelCase parameter on this endpoint. Spelling it `page_size` is
silently ignored.**
Every other parameter (`model_name`, `token_name`, `start_timestamp`, `request_id`, …) uses
snake\_case — this one does not. Getting it wrong does not raise an error: the server treats the
parameter as absent and **falls back to the default of 10 records per page**, which is easy to
misread as "the cap is 10" or "I only made 10 calls in this period."
```
?pageSize=1000 ✅ returns 1000 records
?page_size=1000 ❌ silently returns 10
```
Going above 5000 does raise a clear error rather than truncating silently.
**Raising `pageSize` is the single most effective optimization for this endpoint.** At 10 records
per page, an account making 500,000 calls a day needs 50,000 requests; at 5000 per page it needs
**100**. Two orders of magnitude fewer requests, and the pagination offset drops with it — see
Performance Notes below.
A 5000-record page measures roughly 700 KB gzipped and takes about 2.5 seconds. If bandwidth or
memory is tight, `1000` is a comfortable middle ground.
### Performance Notes
The cost of a single request is **not fixed**. It depends on three things. Follow these rules and
the API is fast; ignore them and you will hit the server-side 60-second query limit and get an
error back.
| Factor | Cheap | Expensive |
| - | - | - |
| **Where the window sits** | The last few days | Weeks or months ago |
| **How wide the window is** | 1 hour to 1 day | A whole month, or no window at all |
| **Offset (`p` × `pageSize`)** | The first few tens of thousands of records | Hundreds of thousands and beyond |
Four practical rules:
1. **Always pass `start_timestamp` and `end_timestamp`.** Omitting the window is the single most
expensive way to call this API.
2. **Raise `pageSize`.** This is the easy one: going from 10 to 1000–5000 records per page cuts
the request count by two orders of magnitude, and the offset falls with it.
3. **Shrink the window instead of deepening the offset.** What costs money is not "which page"
but "how many records were skipped to get there", and that grows super-linearly. Rather than
paging all the way through one large window, split it into 24 one-hour windows so every
window starts again from offset 0.
4. **Backfill history once, store it, then only sync increments.** Old data costs far more to
query than recent data, so repeatedly re-reading the same history is pure waste.
If a window still takes dozens of pages at `pageSize=1000`, your call volume for that period is
high — **split the window in half and fetch each half separately**. That is much faster than
paging deeper. The `MAX_PAGES` constant in the Python example below does exactly this.
#### 60 seconds is a hard limit, and exceeding it returns an error
The server caps any single query at **60 seconds**. Past that you do not get a slow response —
**you get an error**, and the time already spent buys you no data at all.
These three patterns are likely to trigger it. Avoid them outright rather than retrying and
hoping:
| Pattern | Why |
| - | - |
| **No time window** | The server has to search your entire history |
| **A window a month or more in the past**, on a high-volume account | Older data costs more to retrieve |
| **An offset in the hundreds of thousands** | The more records skipped, the slower — super-linearly |
**Retrying with the same parameters will not be faster**, it just costs another 60 seconds. The
right response is to **narrow the time window**, or raise `pageSize` so there is less paging —
either way, give the server less data to work through per call.
### Log Types
| Value | Meaning | Notes |
| - | - | - |
| `1` | Top-up | Records balance before and after; `quota` is 0 |
| `2` | **Consumption** | **The only type you need for reconciliation**; `quota` is the actual charge |
| `3` | Administrative | Account changes and similar operations; `quota` is 0 |
| `4` | System | System-granted credit and similar; `quota` is 0 |
| `11` | Async task refund | The pre-charge is refunded in full when a video or other async task fails; `quota` is **negative** and `content` carries the task\_id |
**Always pass `type=2` when calculating spend.** Without it, top-up and system-grant records are
returned as well. Their `quota` is 0, but `model_name` and `token_name` are also empty, so naively
summing or grouping by model will produce wrong results.
If the account uses async video models (Seedance and similar), **also pull `type=11`**: when a task fails, its pre-charge comes back as a negative refund entry, and summing only `type=2` would count that pre-charge as spend.
## Response Details
### Success Response Example
```json theme={null}
{
"success": true,
"message": "",
"data": [
{
"request_id": "2026080114481936471351696e93ae3FTV8WKfk",
"created_at": 1785595715,
"type": 2,
"content": "Fixed model price 0.015, group ratio 1",
"username": "your-account",
"token_name": "production-primary",
"token_group": "default",
"model_name": "gpt-5.6",
"quota": 7500,
"prompt_tokens": 1000,
"completion_tokens": 0,
"duration_for_view": 16,
"is_stream": false,
"error_code": "",
"other": "{\"billing_type\":\"by_count\",\"request_path\":\"/v1/images/generations\",\"group_ratio\":1,\"model_ratio\":1,\"usage\":{}}"
}
]
}
```
### Key Response Fields
| Field Name | Type | Description |
| - | - | - |
| `quota` | Integer | **The amount actually charged for this call**, in credits; ÷ 500,000 = USD |
| `content` | String | Human-readable pricing note, e.g. fixed model price and group ratio |
| `model_name` | String | The model actually billed |
| `token_name` | String | Which API key made the call |
| `token_group` | String | The token's group — note this is the group identifier, see FAQ |
| `prompt_tokens` / `completion_tokens` | Integer | Input / output token counts |
| `duration_for_view` | Integer | Call duration in seconds |
| `is_stream` | Boolean | Whether the call was streamed |
| `error_code` | String | Failure reason code; empty string on success |
| `created_at` | Integer | Call time, Unix seconds |
| `request_id` | String | **Request ID — provide this when opening a support ticket** |
| `other` | String | Additional billing and request detail, **a JSON string that must be parsed again** |
The `other` field holds a JSON **string**, not a nested object, so it needs a second parse
(`json.loads()` in Python, `JSON.parse()` in JavaScript). It contains `billing_type`,
`request_path` (the endpoint actually called), `group_ratio`, `model_ratio`, and `usage`.
Settlement entries for async video tasks also carry `final_quota` (the task's final total), `original_quota`
(the pre-charge taken at submission), `adjustment_quota` (this entry's difference) and `actual_tokens`; see the FAQ below.
### Quota Conversion
500,000 quota = \$1.00 USD
**Formula:** USD amount = `quota` ÷ 500,000
**Examples:**
* `quota: 7500` → \$0.015 USD
* `quota: 22500` → \$0.045 USD
* `quota: 18` → \$0.000036 USD
This is the same conversion used by the [Balance Query API](/en/api-capabilities/balance-query),
so the two line up directly.
## Error Responses
### HTTP 401 - Authentication Failed
```json theme={null}
{
"success": false,
"message": "You are not authorized to perform this operation. The access token is invalid."
}
```
**Reason:** The system token is invalid or expired, or an API key (starting with `sk-`) was
mistakenly used as a system token.
**Solution:** Regenerate the system token in the console, and make sure `Authorization` carries
the raw value **without a `Bearer` prefix**.
## Code Examples
### cURL Example (single page, quick check)
```bash theme={null}
export APIYI_SYS_TOKEN='YOUR_SYSTEM_TOKEN'
# Last hour only. Always pass start/end — a query without a time window will likely time out
END=$(date +%s)
START=$((END - 3600))
curl --compressed -s "https://api.apiyi.com/api/log/self?p=0&pageSize=1000&type=2&start_timestamp=$START&end_timestamp=$END" \
-H "Authorization: $APIYI_SYS_TOKEN" \
-H 'Accept: application/json' | jq '.data[] | {created_at, model_name, quota, request_id}'
```
**The `--compressed` option is required**, because the API returns gzip-compressed content.
Without it you will get garbled output.
Use this to confirm your token works. For real reconciliation, use the daily sync script below.
### Python Example: daily incremental sync (ready to use as a cron job)
This is the **recommended standard usage**: run it once a day, pull only what is new since the
last sync, and write it into a local SQLite database. Re-running is safe (records are
deduplicated on `request_id`), and a run interrupted halfway resumes from where it stopped.
```python theme={null}
"""Daily incremental sync of APIYI call logs. Run once a day, e.g. crontab: 30 2 * * *"""
import json
import os
import sqlite3
import time
import requests
BASE = "https://api.apiyi.com"
TOKEN = os.environ["APIYI_SYS_TOKEN"]
QUOTA_PER_USD = 500_000
DB_PATH = "apiyi_logs.db"
WINDOW = 3600 # width of one time window in seconds; 1 hour suits most accounts
PAGE_SIZE = 1000 # records per page, server max is 5000. NOTE: the param is camelCase
MAX_PAGES = 50 # max pages per window; beyond this the window is split in half
SLEEP = 1.0 # gap between pages — call serially, never concurrently
FIRST_RUN_DAYS = 7 # how far back to backfill on the very first run
HEADERS = {"Authorization": TOKEN, "Accept": "application/json"}
def open_db():
con = sqlite3.connect(DB_PATH)
con.execute("""
CREATE TABLE IF NOT EXISTS logs (
request_id TEXT PRIMARY KEY,
created_at INTEGER,
model_name TEXT,
token_name TEXT,
quota INTEGER,
error_code TEXT,
raw TEXT
)""")
con.execute("CREATE INDEX IF NOT EXISTS idx_created ON logs(created_at)")
con.commit()
return con
def get_page(start, end, page):
resp = requests.get(
f"{BASE}/api/log/self",
headers=HEADERS,
params={
"p": page,
"pageSize": PAGE_SIZE, # camelCase! page_size is ignored and you get 10 per page
"type": 2, # 2 = consumption, the only type used for reconciliation
"start_timestamp": start,
"end_timestamp": end,
},
timeout=60, # the server-side query limit is also 60 seconds
)
resp.raise_for_status()
return resp.json().get("data") or []
def fetch_window(start, end):
"""Fetch [start, end]. Splits the window in half if pagination gets too deep."""
rows, seen, page = [], set(), 0
while page < MAX_PAGES:
data = get_page(start, end, page)
if not data:
return rows # empty array means this window is done
fresh = [r for r in data if r.get("request_id") not in seen]
if not fresh:
return rows # whole page was duplicates, defensive exit
seen.update(r["request_id"] for r in fresh)
rows.extend(fresh)
page += 1
time.sleep(SLEEP)
if end - start <= 1:
return rows
mid = (start + end) // 2 # too much volume here: fetch each half separately
return fetch_window(start, mid) + fetch_window(mid + 1, end)
def sync():
con = open_db()
row = con.execute("SELECT MAX(created_at) FROM logs").fetchone()
cursor = (row[0] + 1) if row and row[0] else int(time.time()) - FIRST_RUN_DAYS * 86400
now = int(time.time())
total = 0
while cursor < now:
end = min(cursor + WINDOW, now)
rows = fetch_window(cursor, end)
con.executemany(
"INSERT OR IGNORE INTO logs VALUES (?,?,?,?,?,?,?)",
[(r.get("request_id"), r.get("created_at"), r.get("model_name"),
r.get("token_name"), r.get("quota"), r.get("error_code"),
json.dumps(r, ensure_ascii=False)) for r in rows])
con.commit()
total += len(rows)
cursor = end + 1
print(f"Synced {total} records into {DB_PATH}")
return con
def report(con, days=1):
since = int(time.time()) - days * 86400
print(f"{'MODEL':32s} {'CALLS':>6s} {'SPEND(USD)':>12s}")
rows = con.execute(
"SELECT model_name, COUNT(*), SUM(quota) FROM logs "
"WHERE created_at >= ? GROUP BY model_name ORDER BY SUM(quota) DESC",
(since,)).fetchall()
for model, cnt, quota in rows:
print(f"{model or '(none)':32s} {cnt:6d} {(quota or 0) / QUOTA_PER_USD:12.4f}")
total = sum((q or 0) for _, _, q in rows)
print(f"\nTotal ${total / QUOTA_PER_USD:.4f} USD")
if __name__ == "__main__":
report(sync(), days=1)
```
**Sample output:**
```
Synced 570 records into apiyi_logs.db
MODEL CALLS SPEND(USD)
gpt-5.6 128 2.3850
gemini-3-pro-image 30 1.3500
deepseek-chat 412 0.0148
Total $3.7348 USD
```
Once the data is local, every breakdown you need — by model, by day, by token — runs against
your own database, so **you never have to query the API again for it**. That is far faster, and
it sidesteps the problem of wanting data that has already aged out of the retention window.
### Node.js Example (single time window)
Same idea: split by the hour, page serially, and shrink the window if pagination gets too deep.
```javascript theme={null}
const BASE = "https://api.apiyi.com";
const TOKEN = process.env.APIYI_SYS_TOKEN;
const QUOTA_PER_USD = 500_000;
const PAGE_SIZE = 1000; // server max is 5000
const MAX_PAGES = 50;
const sleep = (ms) => new Promise((r) => setTimeout(r, ms));
async function getPage(start, end, page) {
const qs = new URLSearchParams({
p: String(page),
pageSize: String(PAGE_SIZE), // camelCase! page_size is ignored and you get 10 per page
type: "2", // 2 = consumption
start_timestamp: String(start),
end_timestamp: String(end),
});
const resp = await fetch(`${BASE}/api/log/self?${qs}`, {
headers: { Authorization: TOKEN, Accept: "application/json" },
});
if (!resp.ok) throw new Error(`HTTP ${resp.status}`);
const { data } = await resp.json();
return data || [];
}
// Fetch [start, end]; split the window in half if pagination gets too deep
async function fetchWindow(start, end) {
const rows = [];
const seen = new Set();
for (let page = 0; page < MAX_PAGES; page += 1) {
const data = await getPage(start, end, page);
if (data.length === 0) return rows;
const fresh = data.filter((r) => !seen.has(r.request_id));
if (fresh.length === 0) return rows;
fresh.forEach((r) => seen.add(r.request_id));
rows.push(...fresh);
await sleep(1000); // serial, never concurrent
}
if (end - start <= 1) return rows;
const mid = Math.floor((start + end) / 2);
return [...(await fetchWindow(start, mid)), ...(await fetchWindow(mid + 1, end))];
}
const end = Math.floor(Date.now() / 1000);
const logs = await fetchWindow(end - 3600, end); // last hour
const total = logs.reduce((sum, r) => sum + (r.quota || 0), 0);
console.log(`${logs.length} calls, $${(total / QUOTA_PER_USD).toFixed(4)} USD`);
```
Both the Python requests library and the Node.js fetch API decompress gzip automatically,
so no extra configuration is needed there. Only curl requires the explicit `--compressed` flag.
## Common Scenarios
### Daily reconciliation (the recommended approach)
Schedule the Python script above to run once a day and land the logs in a local database. Every
breakdown you need — total spend, per model, per token — is then a SQL query against **your own**
database.
Three reasons this is the right shape: local queries are fast; you are not exposed to the log
retention window; and you avoid slowing the API down by repeatedly re-reading old history.
To sync only one model's records, add the `model_name` parameter to the request.
### Finding failed calls
Once the data is local, query your own table directly:
```sql theme={null}
SELECT created_at, model_name, error_code, request_id
FROM logs
WHERE error_code != '' AND created_at >= strftime('%s', 'now', '-1 day')
ORDER BY created_at DESC;
```
Requests rejected by the gateway (invalid parameters and similar) have `quota` of 0 and
**are not charged**. The `error_code` in the log lets you separate "the call failed" from
"the call succeeded but I did not like the result."
### Providing a request ID for support
Locate the problematic call in the logs and give support the `request_id`. That identifies the
exact request end to end, which is far more efficient than describing "a call to some model
failed around a certain time."
## FAQ
Check these three things first; almost every slow query comes from one of them:
1. **Are you passing `start_timestamp` and `end_timestamp`?** Omitting the time window is the
most expensive way to call this API — the server searches your entire history.
2. **Is the window too old or too wide?** Querying data from a month ago costs far more than
querying yesterday. Keep the span under one day, and split by the hour for high volumes.
3. **Has `p` reached several thousand?** Pagination cost grows super-linearly. The fix is to
**shrink the time window so each window needs only a few dozen pages**, not to page deeper
within one large window.
**Retrying the same parameters will not be faster.** On a timeout, adjust the parameters as
above rather than repeating the identical request — a plain retry just makes you wait again.
**Nine times out of ten, the parameter was spelled `page_size` in snake\_case.**
The correct spelling is camelCase `pageSize`. It is the only camelCase parameter on this
endpoint — everything else (`model_name`, `token_name`, `start_timestamp`, …) is snake\_case,
which makes this an easy one to get wrong. It does not raise an error; the server treats the
parameter as absent and falls back to 10 records per page.
```
?pageSize=1000 ✅ 1000 records
?page_size=1000 ❌ 10 records
```
The maximum is 5000, and going above that returns a clear error. For large volumes you still
need to paginate (`p=0`, `p=1`, …) until the response returns an empty array — the Python and
Node.js examples above already encapsulate this.
Yes — pass `request_id`, and only that record is returned:
```bash theme={null}
curl --compressed -s "https://api.apiyi.com/api/log/self?request_id=YOUR_REQUEST_ID" \
-H "Authorization: $APIYI_SYS_TOKEN"
```
When investigating one specific call, this is much faster than pulling a time range and
filtering it yourself.
No. Certain fields hold platform-internal information and are empty or zero from a regular
account's perspective. This is expected and does not affect the fields you need for
reconciliation or troubleshooting — `quota`, `model_name`, `error_code`, and `request_id`
are all fully populated.
The API returns the group **identifier**, while the console displays the group's **label**.
These can differ — for example the API returns `default` while the console shows Default.
The full mapping is available from the public endpoint `https://api.apiyi.com/api/pricing`
under the `usable_group` field, which maps identifier to label. If you want your reports to
match the console, apply that mapping yourself.
Use `quota`. It is the amount **actually deducted** for the call and the only field suitable
for reconciliation. For per-call priced models such as image and video generation, the token
counts in the response may be placeholder values that do not participate in pricing —
those models report `by_count` in `other.billing_type`.
**Design your sync logic assuming only the last 30 days are queryable.**
In practice the queryable range is usually longer, but we **make no commitment on retention**
— it changes with log cleanup policy, and changes are not announced separately. Treat 30 days
as your planning floor and your reconciliation will not break when that policy shifts.
Separately, **the older the window, the more the query costs**: even when the data is still
there, reaching it is much slower.
So the right pattern is to **sync once a day into your own database** and run historical
analysis locally. Anything you need to keep long term, archive yourself — do not rely on this
API to fetch it back.
**Reason:** the API returns gzip-compressed content (`Content-Encoding: gzip`) and curl is
not decompressing it.
**Solution:** add the `--compressed` flag:
```bash theme={null}
curl --compressed 'https://api.apiyi.com/api/log/self?p=0' \
-H "Authorization: $APIYI_SYS_TOKEN" | jq
```
The Python requests library and the Node.js fetch API decompress automatically.
Async video tasks (Seedance and similar) are billed as "pre-charge at submission, settle the difference on completion",
so one video leaves two entries: the pre-charge (`completion_tokens` is 0, `request_id` present) and the settlement
(`completion_tokens` is the actual usage, **`request_id` is empty**, `quota` is only the difference).
**Neither entry carries the `task_id`**, so this API cannot pair entries to tasks.
To get a video's real cost, query the task API by `task_id`; its `quota` is the sum of the two entries:
```bash theme={null}
curl --compressed -s "https://api.apiyi.com/api/task/self?p=1&page_size=1&task_id=YOUR_TASK_ID" \
-H "Authorization: $APIYI_SYS_TOKEN"
```
Note that its paging parameters are snake\_case `page_size` with `p` starting at 1, the opposite of this API.
A failed task still shows its pre-charge in `quota`, but its real cost is 0 (the logs contain a negative `type=11` refund entry).
Full walkthrough: [How to look up a Seedance video's real cost by task\_id](/en/faq/seedance-task-cost-lookup).
No. The log query endpoint does not consume any quota.
## Important Notes
**A system token is not an API key, and the two are not interchangeable**
* An **API key** (starting with `sk-`) is for `/v1/*` inference endpoints. Using it against
`/api/log/self` returns 401.
* A **system token** (a plain string with no prefix) is for `/api/*` management endpoints.
Using it against `/v1/chat/completions` returns an invalid-token error.
A system token's scope covers your entire account, so **treat it like your account password**:
store it in a secret manager rather than in code, never commit it to a repository, and rotate
it periodically.
**Log responses contain your own API keys in plain text**
Each log record carries information about the token that made the call. **Do not paste raw log
responses into public places, share screenshots of them, or hand them to third parties** —
strip sensitive fields before exporting.
Note in particular that this plaintext does not carry the `sk-` prefix, so **common secret
scanners may not detect it**. Do not rely on automated checks to catch it for you.
**Recommended call pattern**
* **Sync once a day** — no need to go more often; each run pulls only what is new
* **Use `pageSize` of 1000–5000**, not the default of 10 — this one matters more than the rest combined
* **Call serially**, roughly one second between pages, **never concurrently**
* Set the client timeout to 60 seconds (the server-side query limit is also 60 seconds)
* Keep each time window to one day or less; split by the hour for high-volume accounts
* On a timeout, **shrink the window before retrying** — an identical retry will not be faster
These are not hard quotas; they are simply the fastest way to get your own data out. Following
this pattern, a typical account syncs a full day of logs in under a minute, and even a heavy
account making hundreds of thousands of calls a day needs only about a hundred requests.
**We reserve the right to introduce rate limiting on this endpoint in the future.**
There is no rate limit on it today, but please **do not design your scheduled jobs around
"unlimited"**. Follow the pattern above — once a day, serial, a large `pageSize` — and a future
rate limit will not affect you.
* [Balance Query API](/en/api-capabilities/balance-query) — check remaining account credit
* [Token Management API](/en/api-capabilities/token-management) — create and manage API keys programmatically
* [How to view my call records](/en/faq/call-logs) — manual inspection in the console
* [Understanding logs and billing](/en/faq/log-billing-explained) — how to read the billing fields
This documentation is built and hosted on [Mintlify](https://mintlify.com), a developer documentation platform.